
A VEXXON Retrospective
The Bottleneck: Chasing the Flicker

VEXXON is officially done and production is rolling. We’ll be shipping out to everyone who pre-ordered very soon. Looking back at the whole journey, the thing I’m proudest of isn’t actually in the game—it’s the simulator I had to build just to track down a single, brutal bug that only shows up on real vector hardware.
For the final stretch of development, I’ve been testing and profiling VEXXON on the actual PiTrex hardware. When it works, it looks gorgeous. When it doesn’t? It flickers.
Flicker is the cruelest bug in vector graphics because it doesn’t actually live in your code. It lives in the physical gap between how many lines you ask the beam to draw, and how many it can actually handle before the phosphor fades.
If you draw 300 lines per frame, the image is rock steady. Push it to 600, and the screen starts to shimmer. Hit 900? You’ve built a strobe light.
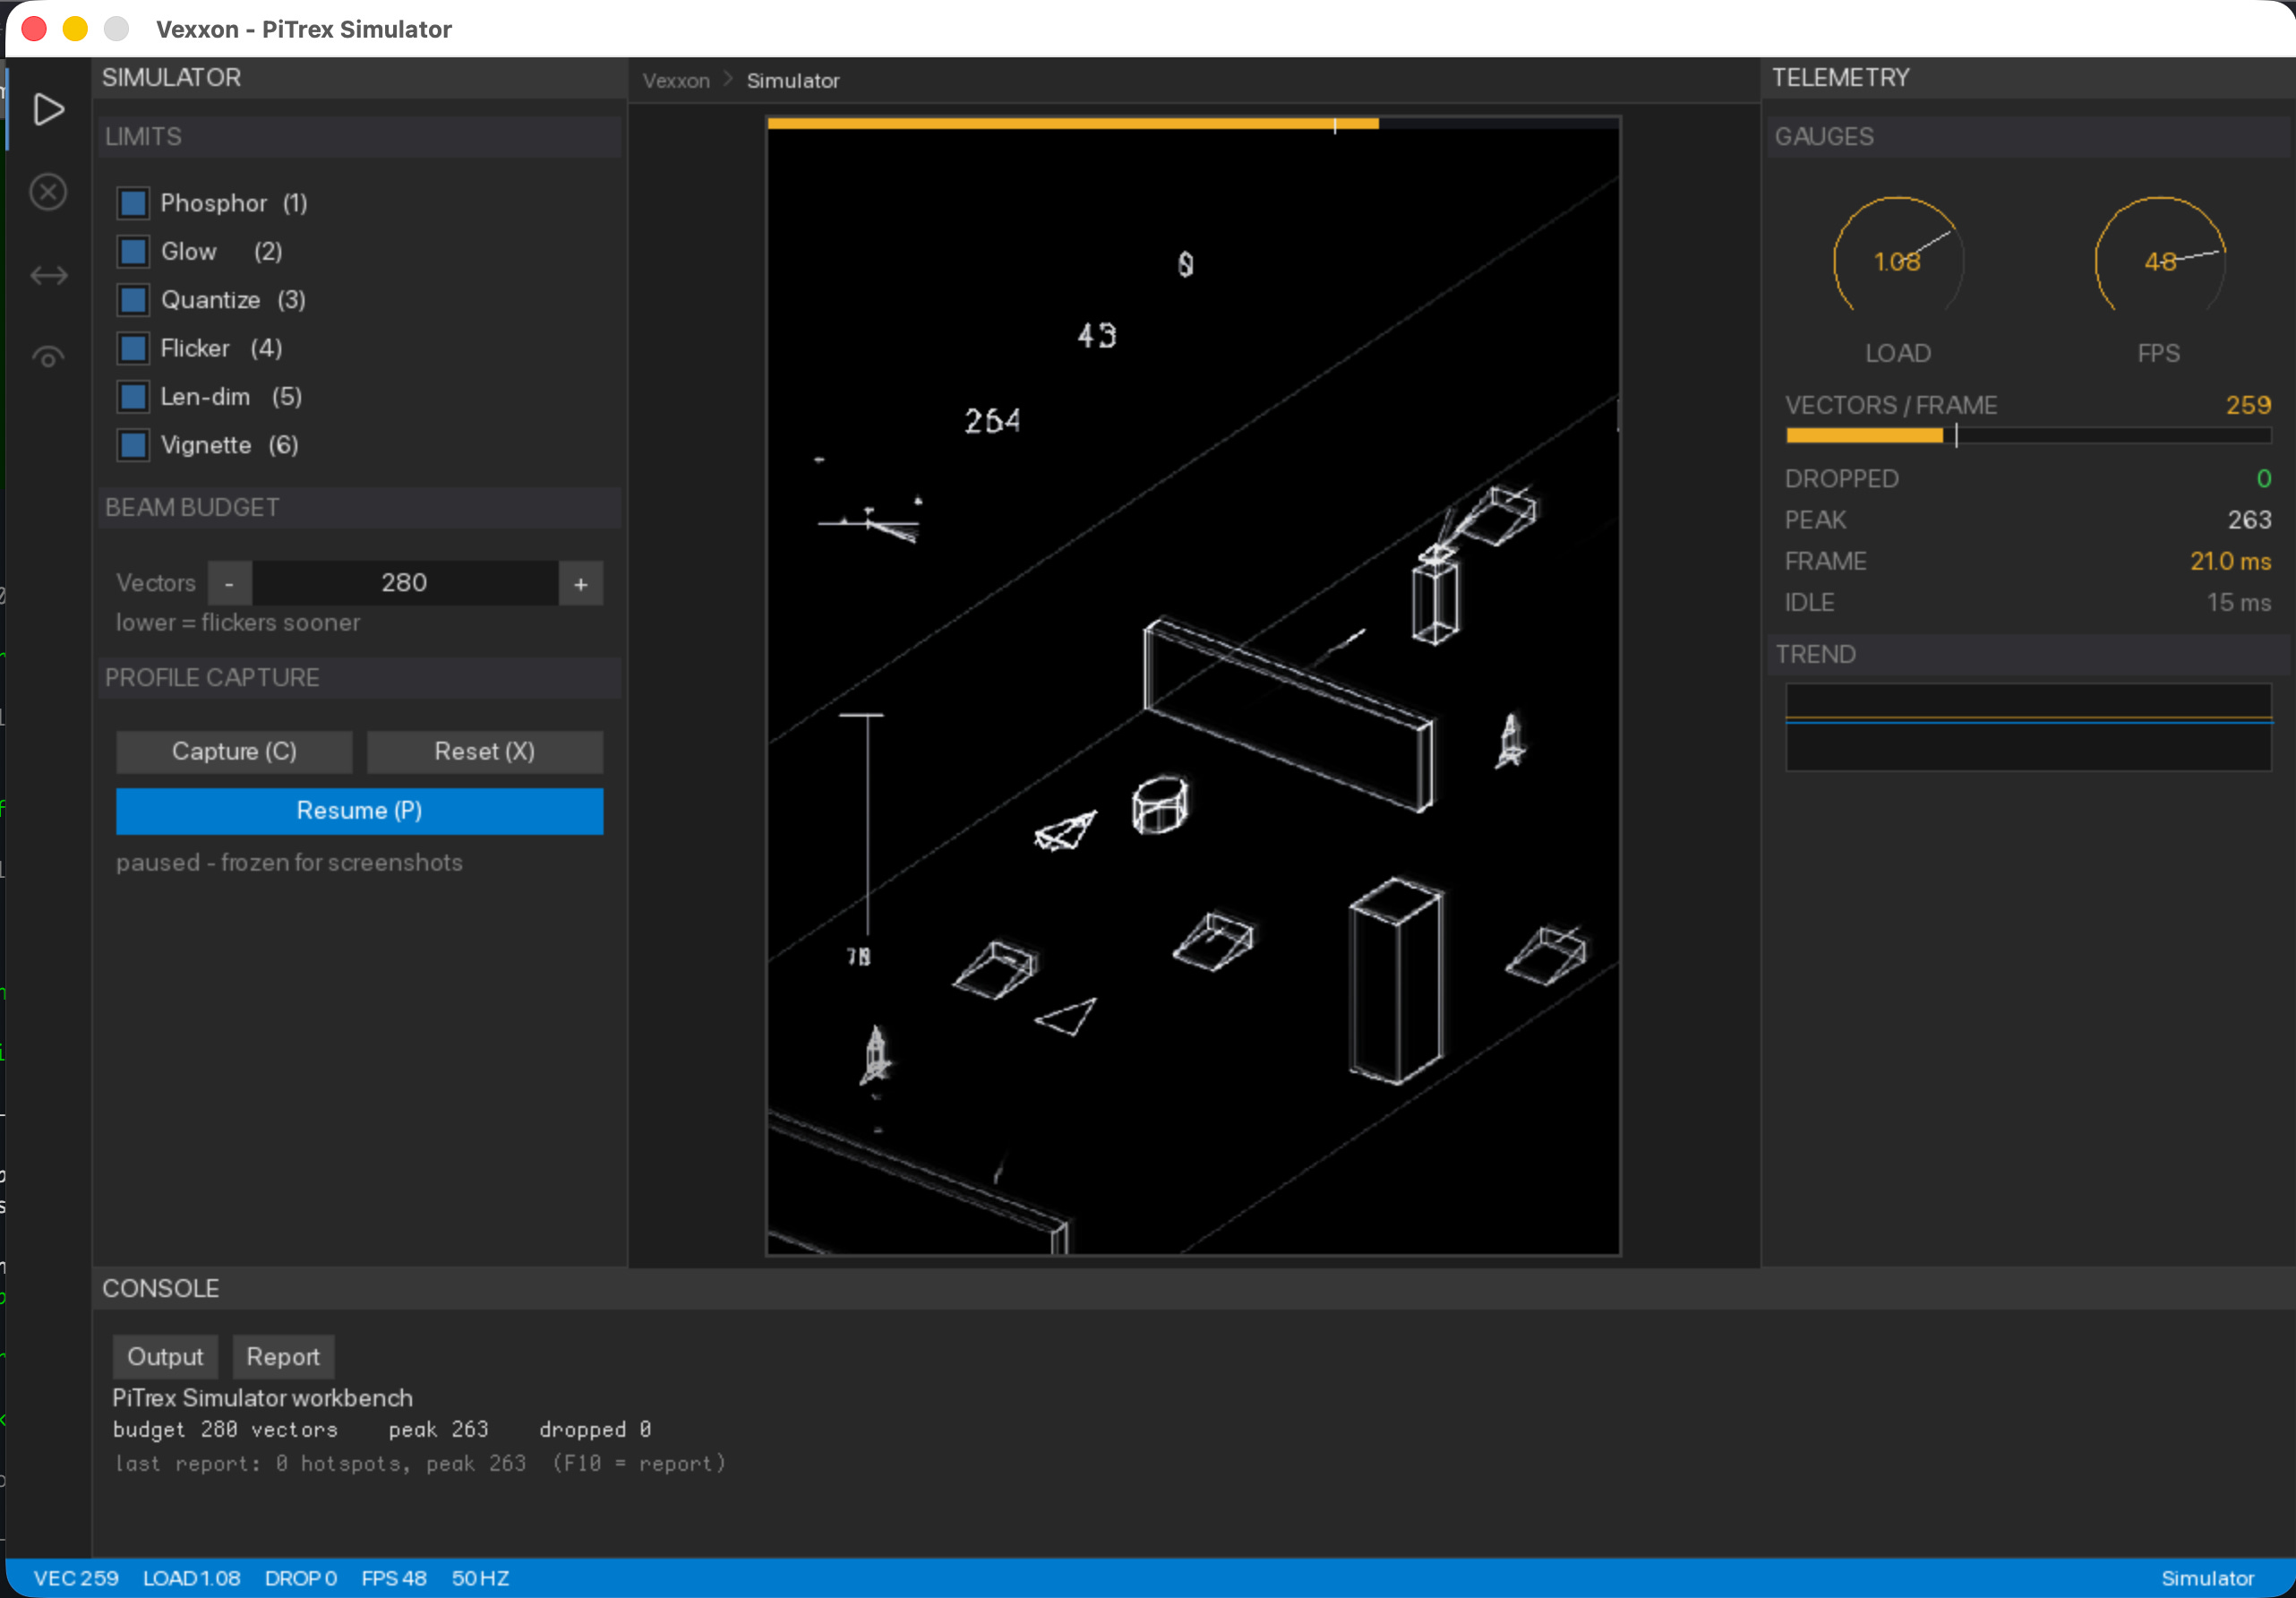
For a native Vectrex game, you can just use an emulator. But for the PiTrex, there isn’t one—you can only see what’s happening on real hardware. That meant every time I wanted to check if the game was getting too dense, I had to cross-compile with the ARM toolchain, copy the image to an SD card, walk over to the Vectrex, boot it up, and squint. (Yes, you can optimize that workflow, but you get the point.)
So, I built a simulator with a built-in profiler. And I don’t mean a superficial look-alike; I mean a true simulator that runs the exact same code as the real hardware and reproduces the one thing standard emulators completely ignore: the physical limits.
Here is how I built it, what it revealed about my own game, and the results.
The Software Stack
Pulling this off was only possible because my codebase was already stacked in clean, isolated layers. At the very top, you have the game logic (spawning enemies, scrolling the world), which knows absolutely nothing about the hardware. Below that is the renderer, which just turns the game’s intentions into standard drawLine() calls.
Then things get hardware-specific. Next down is the PiTrex platform layer, which handles clipping, reads the joystick, and maps my 600×800 screen into the Vectrex’s bizarre, tall 3:4 portrait coordinate space ($\pm18000 \times \pm24000$). That talks to the PiTrex library (vectrexInterface.h)—the actual API pushing vectors via functions like v_directDraw32 and v_WaitRecal. And finally, at the bottom, is the bare metal, banging bytes into a 6522 VIA chip’s registers over the GPIO bus.
The breakthrough for a real simulator comes down to a simple rule: you can swap out any single layer and leave everything above it untouched.
My existing desktop preview build (plain SDL) was kind of a cheat. It swapped in its own drawLine way up near the top, meaning it never actually touched a single line of real PiTrex code. It was fine for a quick preview, but a bug in the coordinate transforms or clipping logic would never show up there.
So, I spliced in one layer lower. I wrote a desktop implementation of the PiTrex library itself—vectrexInterface.h—and let everything above it compile byte-for-byte identical to the code that flashes onto the Pi. The coordinate math, the clipping, the input mapping, the frame pacing: it’s all the real port code running on my Mac, with SDL just standing in for the electron beam.
The best part? The surface area I actually had to fake was tiny. Out of about thirty functions in that header, exactly five do any real work—drawing a vector, waiting for retrace, setting brightness, reading the stick, and reading the clock. The rest are just no-ops.
Writing a true Vectrex hardware emulator is a months-long project. This took me a weekend, because I wasn’t emulating the hardware—I was emulating the contract.
Teaching SDL to Fake a Vacuum Tube
A vector monitor isn’t just a display that happens to draw lines. It’s a quirky analog instrument, and if you want a simulator to look right, you have to deliberately code all its physical flaws back into the engine.
Take phosphor persistence. On a CRT, the beam paints a spot and moves on, but the glow lingers for a few milliseconds. If you just draw lines, it looks too sterile. So I render everything into a texture and dim it slightly every frame. Suddenly, vectors leave these short, organic trails instead of harsh, permanent pixels.
Then there’s bloom. Bright vectors blow out and form a halo, especially where lines cross. I dropped in a couple of cheap additive offset passes, and boom—intersecting lines pool into bright little knots, just like the real tube.
I also had to bake in brightness vs. speed. The beam sweeps a long line much faster than a short one, meaning it deposits less energy per inch. Long vectors are naturally dimmer. Fixing that was just a quick division by length. Even DAC stepping needed a hack. Because positions are 8-bit integers multiplied by a scale factor, distant geometry snaps to a grid. Quantizing the endpoints on the desktop side brought that hardware jitter right back.
But the absolute monster to simulate was flicker.
On a real Vectrex, it doesn’t just lag evenly. It sparkles because the hardware beam literally runs out of time mid-frame. The last elements in the draw call are the ones that get cut off. It’s not a simple line-count problem.
Instead of counting lines, I just modeled the beam’s clock directly. Every vector costs a chunk of “beam time” (a base overhead plus its length), and I keep a running tally during the draw cycle. The second that total blows past the budget, every vector after it has a scaling probability of getting skipped that frame.
The effect is spot on. The light parts of the scene sit rock steady, while the dense, heavy zones strobe and crawl. Combined with the fast phosphor decay, it perfectly mimics the real hardware. The whole flicker law sits in about ten lines of code, anchored to a single tunable variable—right now set to 280 vectors—that I can tweak like a dial until the simulator matches the tube sitting on my desk.
Telemetry & Portability
Once the simulator was running the real code, I added a side panel for live telemetry—something you obviously can’t get on the actual hardware.
The UI splits the screen: Vectrex view on the left, diagnostics on the right. I added a radial gauge for beam load, a bar chart marking the 200–400 vector “sweet spot” against the hardware budget, and a live counter showing exactly how many lines are dropping per frame. There’s also an FPS counter, frame time readouts, a rolling sparkline for vector spikes, and a row of toggles to turn individual effects (phosphor, bloom, flicker, etc.) on and off for quick A/B testing.
This completely solved the “walk-across-the-room” testing loop.
Actually, it solved an even bigger issue: travel. I’m constantly on the move, and my Vectrex is usually sitting at home hundreds of kilometers away. You can’t develop a game if your only test target is in a different city. Folding the entire machine’s physics and limitations into a laptop meant I could keep coding on trains, planes, and at hotel desks. That alone made the tool project worth it.
Level Profiling & Auto-Thinning
A live gauge tells you that you’re over budget, but it doesn’t tell you where or why. I wanted the simulator to profile an entire playthrough and generate a target map.
Because of the layered architecture, this was straightforward. The game tracks the current scroll position, and every level object has a fixed offset. An object is active precisely when the scroll position passes it. By logging (scroll_position, vector_count) every frame, I can map any flicker spike back to the exact gun turrets or walls causing it.
The profiler logs every gameplay frame and outputs:
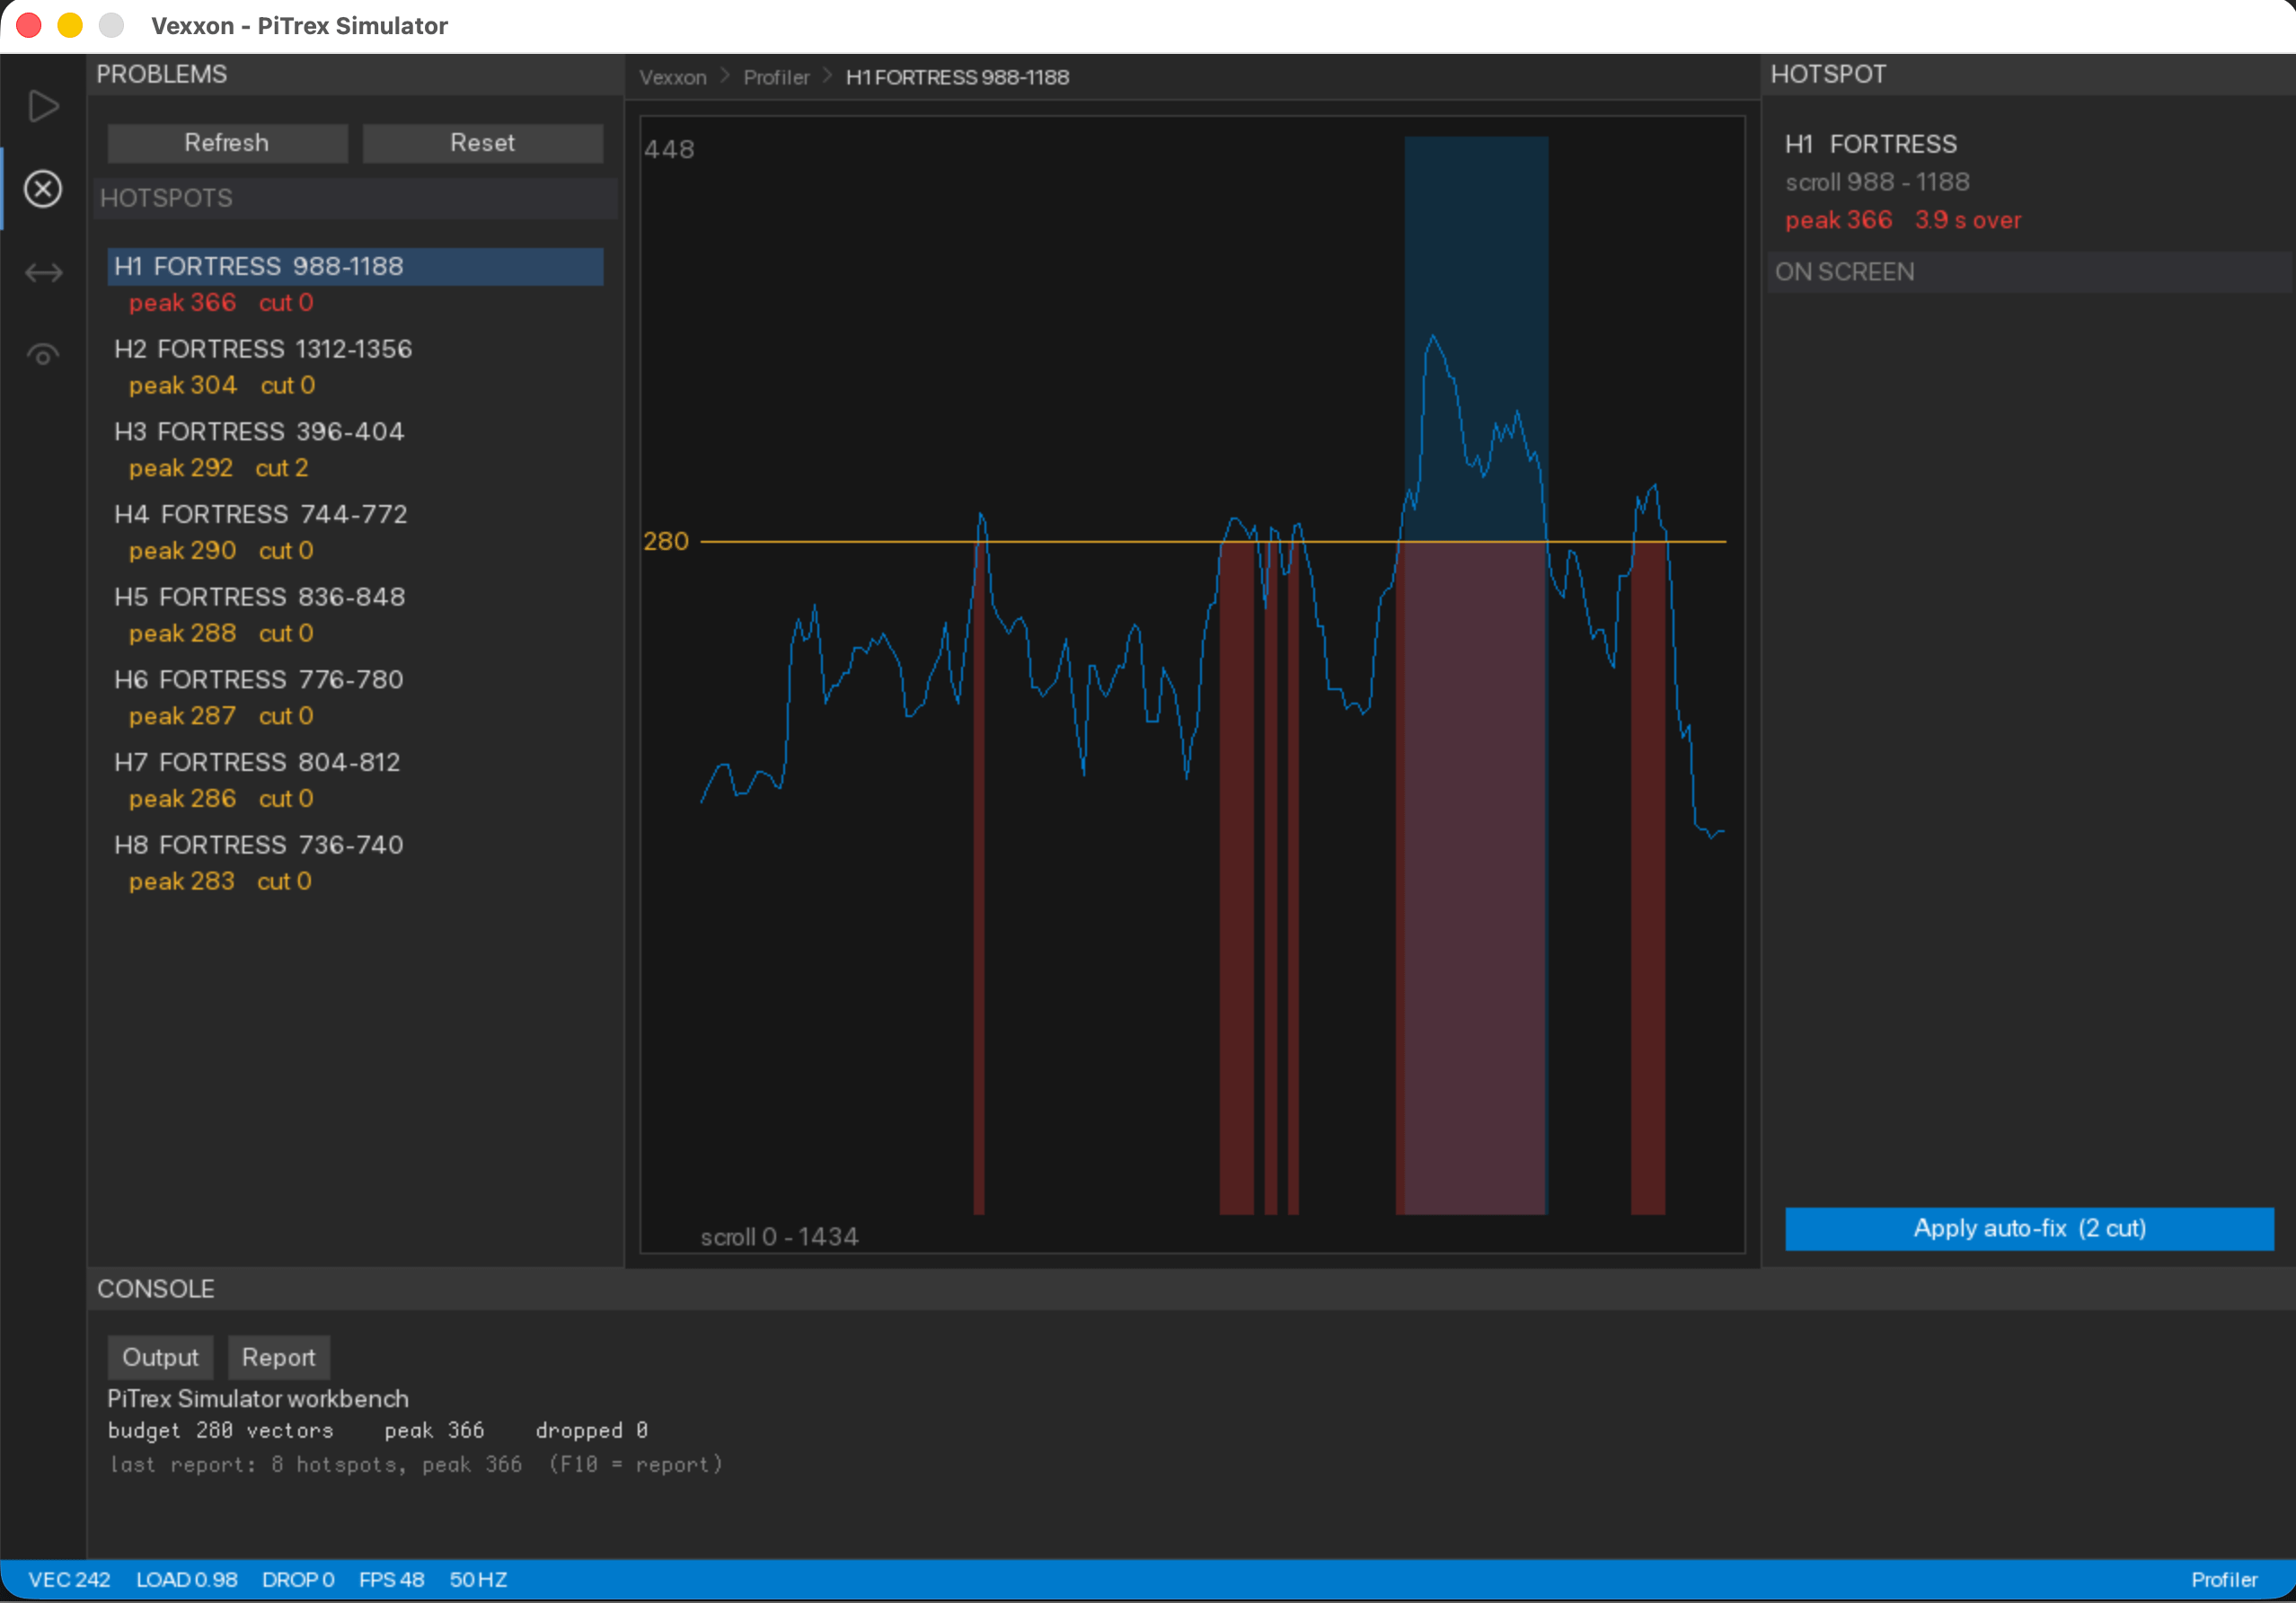
Hotspot Detection: Bins the run by scroll position to locate stretches where the vector count blew past the budget.
Object Mapping: Ranks the problem areas and identifies the specific level objects (by ID and type) crowding the screen.
Data Output: Generates a Markdown report and a raw CSV.
Finally, it handles optimization automatically. It processes the level file and thins the worst clusters—dropping redundant gun turrets and decorative blocks while strictly preserving critical elements like walls, fuel, and power-ups. It writes this to a new file for easy review and diffing, leaving the original asset untouched.
Two Early Bugs
Nothing this satisfying arrives clean.
The first time the auto-optimizer ran, it flagged 87 objects for deletion, which would have gutted the level. The issue was conceptual: the profiler attributed hotspots to every object currently within the draw distance, which on the Vectrex is wider than an entire level section. As a result, every vector spike blamed every object on screen. The fix was to isolate attribution to local clusters—the dense areas where the beam actually chokes—and to cap the maximum number of deletions per cluster. This reduced the adjustments to 19 sensible cuts.
The second bug exposed an actual design flaw. The initial data capture reported a severe hotspot frozen at scroll position 1066 for three solid seconds, despite no level objects being nearby.
The data was from the game-over screen. While the scroll position was frozen where the player died, the vector load from the static text overlay was heavy enough to exceed the hardware budget and choke the beam. The profiler was accurately logging a performance bottleneck caused by the UI. This insight forced a redesign of how the game-over screens handle text rendering to keep them within budget.
What the Data Revealed
Running a clean, 36-second capture through the opening fortress immediately quantified the performance profile: a peak of 356 vectors against the 280-vector hardware budget, with 6.9% of the frames exceeding the limit across seven distinct hotspots.
The worst bottleneck occurred between scroll positions 976 and 1080. I had packed this specific stretch with turrets, pinning the beam at 356 vectors for two full seconds. Conversely, four of the remaining six hotspots were only marginally over budget (ranging from 287 to 298 vectors), meaning they required minimal adjustments to clear.
This data shifts the optimization process from guesswork to targeted fixes. Instead of guessing that a level section feels “heavy,” the profiler isolated the exact coordinates (position 976 to 1080) and identified the specific six turrets causing the spike. I had playtested those spots dozens of times on the real tube and only noticed a vague stutter; the simulator provided the exact coordinates needed to fix it.
Model vs. Machine
The simulator models the software API contract, not the silicon. Instead of emulating the 6522 VIA timer quirks, integrator slew rates, or register settling times, I abstracted these hardware physics into a single BEAM_BUDGET variable.
Analog hardware is inherently variable. Component aging, drift, and integrator settling times mean my Vectrex flickers at a vector count another console might tolerate. There is no single “correct” hardware budget specification; BEAM_BUDGET is simply a tuning parameter dialed in to match my specific desk unit.
Fidelity Boundaries
Exact: Game logic, coordinate transforms, viewport clipping, and byte-for-byte vector generation.
Approximate: Beam physics. It isolates performance hotspots in the correct order but cannot predict the exact millisecond a specific CRT begins to shimmer.
Achieving cycle-accuracy would require real-time emulation of the VIA and integrators—a separate, high-overhead project. For development, this approximation is sufficient. The simulator converts a slow, physical testing loop into instant, numeric feedback. The actual hardware remains the ground truth for final calibration, but it is no longer required for day-to-day iteration.
Post-Mortem: Visualizing the Limit
VEXXON is done. It runs on the real hardware, fully meeting my own quality standards.. Looking back, the part of the project I’m proudest of isn’t a level, a boss, or a gameplay mechanic—it’s this tooling.
Vector hardware forces an architectural shift. On modern platforms, rendering extra geometry is essentially free until you hit a GPU bottleneck. On a Vectrex, every single line expends a fixed, unyielding asset: beam time. Overspend by even a fraction, and the hardware instantly penalizes your entire image with physical flicker.
That constraint sounds like a cage, but it ended up being highly clarifying. It forced every object in the level files to earn its rendering budget, making the final game leaner and better structured. The simulator didn’t change the budget; it just made it visible for me.
The main takeaway for the next project is straightforward: when hardware imposes a hard limit, don’t guess from across the room. Build the telemetry to watch it. The constraint was never the problem—developing without visibility was.
VEXXON is a vector shoot-’em-up for the PiTrex/Vectrex. To test it, I built a sibling compilation target that swapped the hardware library for an SDL window and a phosphor model. It was supposed to be a minor debugging convenience, but it ended up driving how I profiled and optimized the entire game.